Dynamic examples
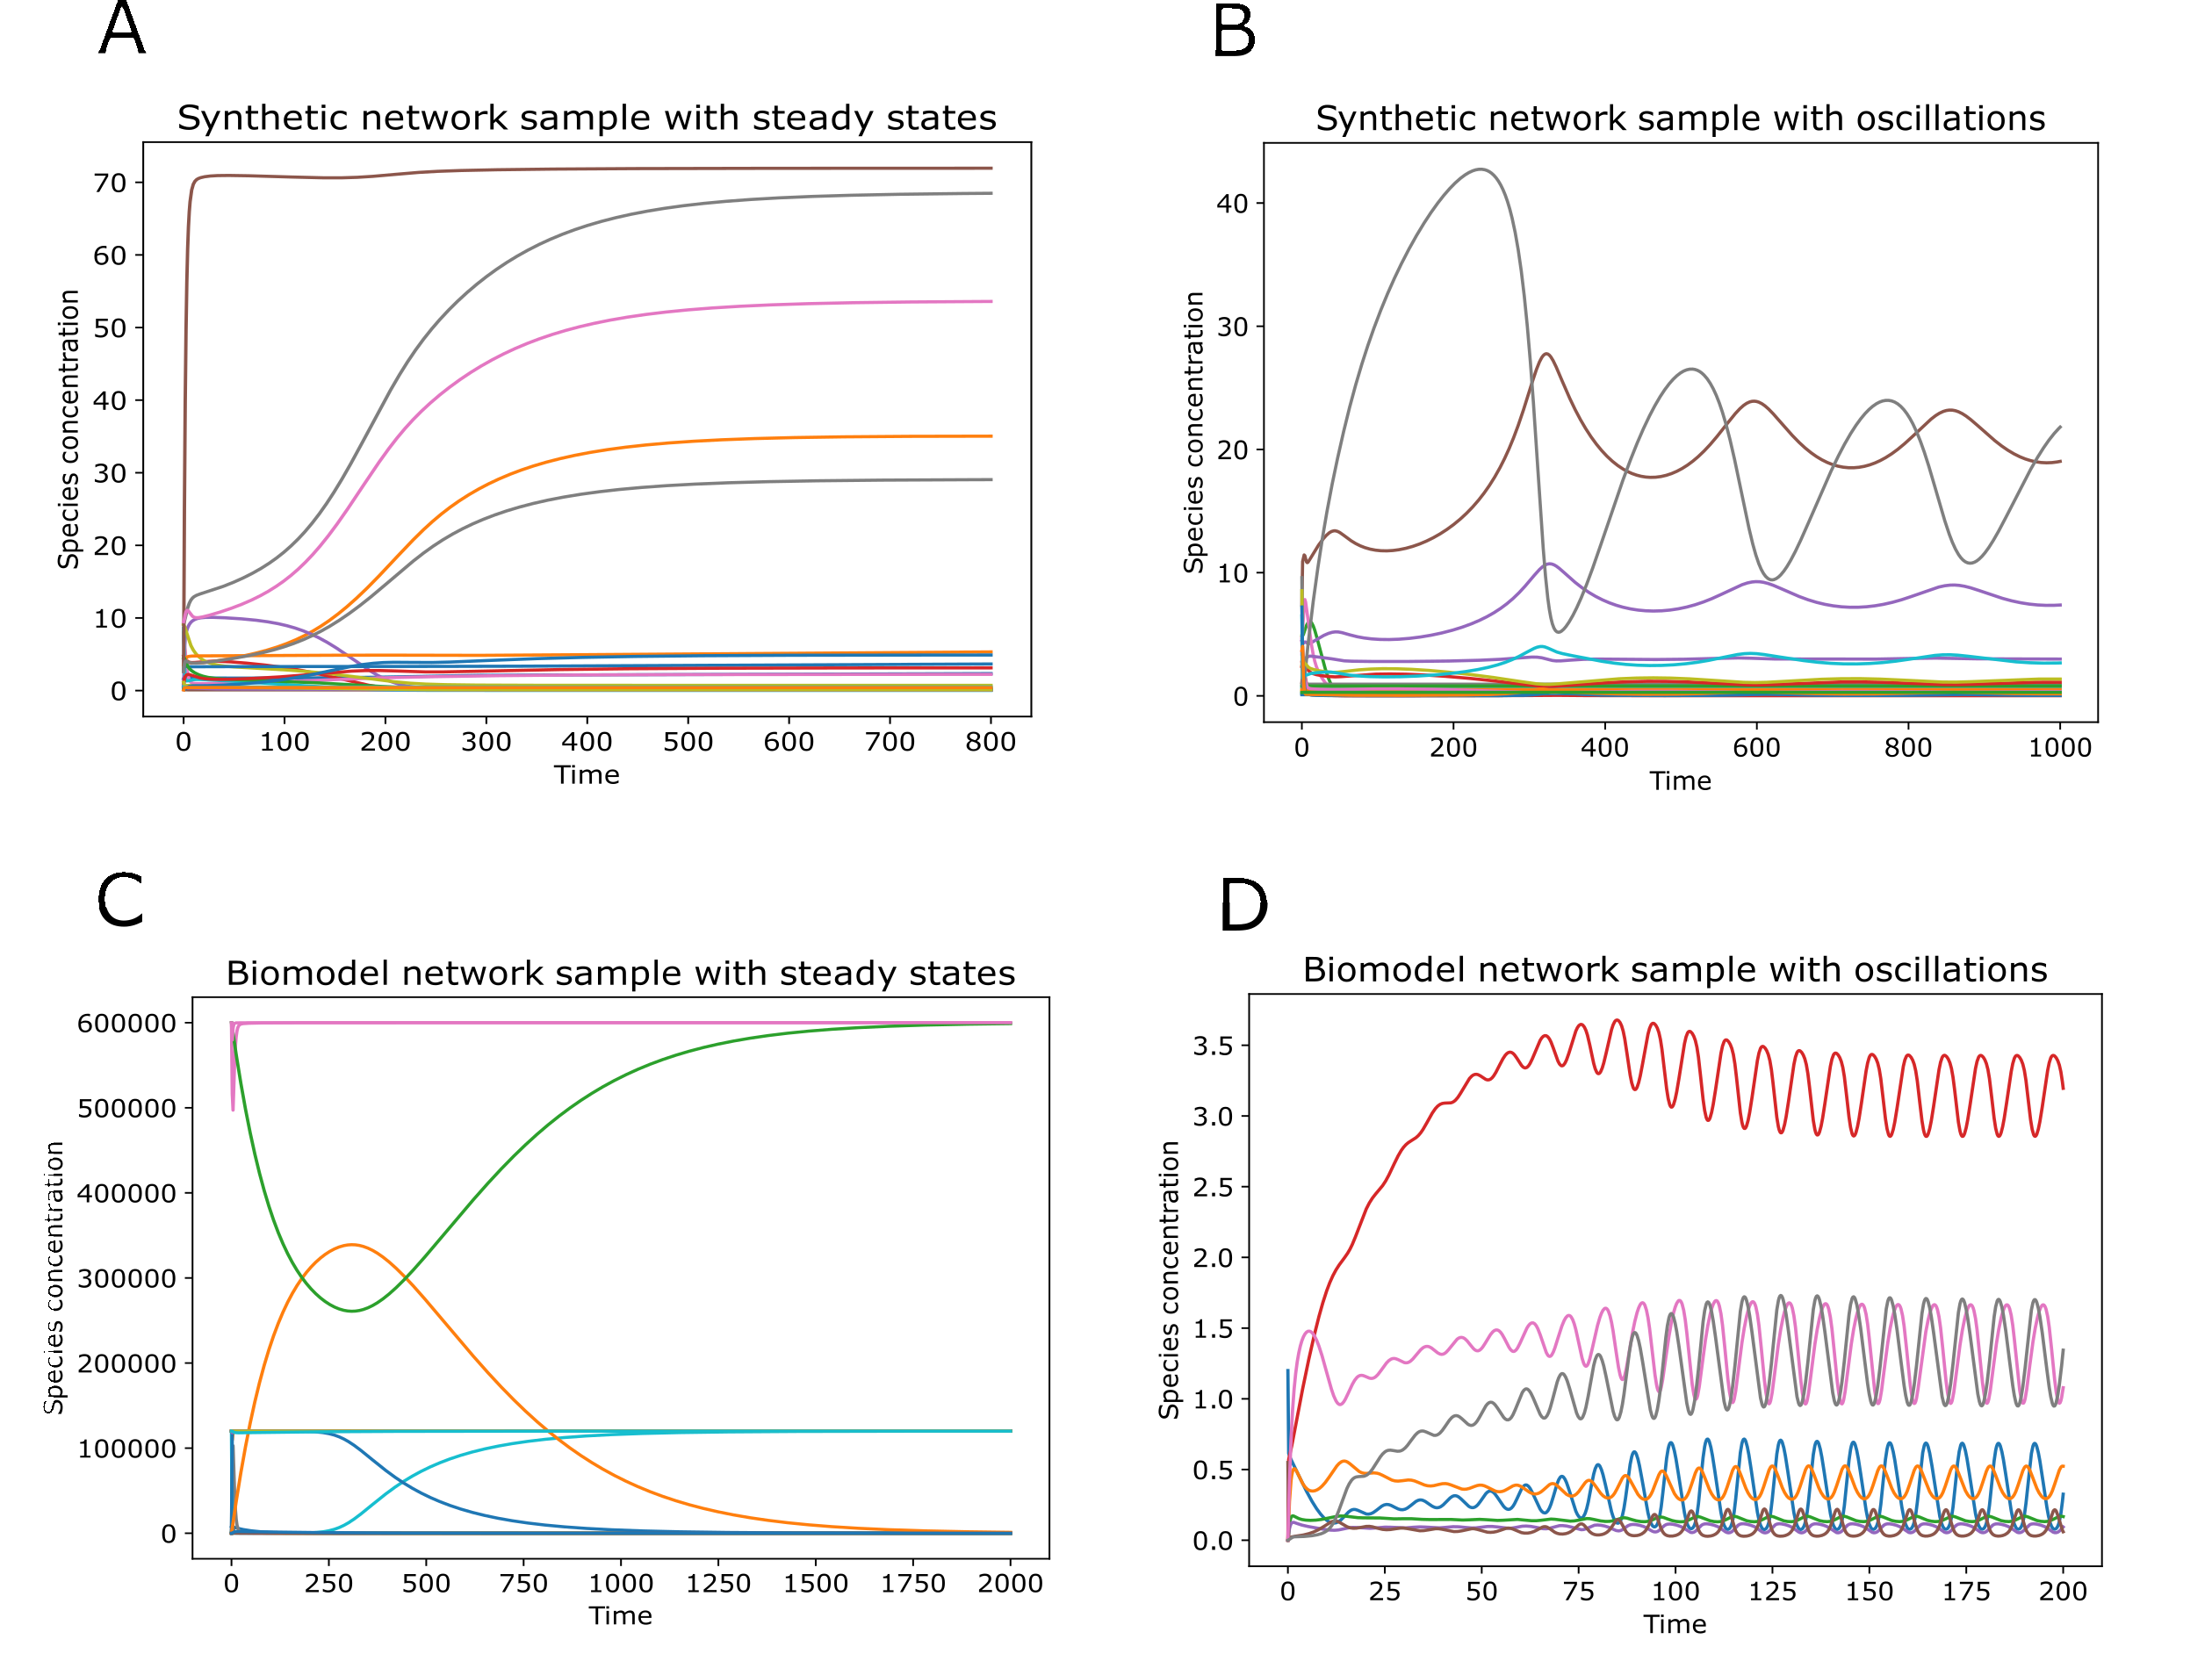
The figures below showed the time-course simulations for four models of signaling networks, and how the concentrations of species reached their steady states. A and B represented the steady states and oscillations from two sample models of our generated synthetic random signaling networks made up of 27 species (including the input and output species) and 35 reactions. C and D showed the steady states and oscillations from two sample models of signaling networks downloaded from the BioModels Database, i.e., C and D showed the dynamic behaviors of BIOMD0000000427 and BIOMD0000000720 separately. The figures were generated by Tellurium version 2.2.5.2. See the SBML files on GitHub.
