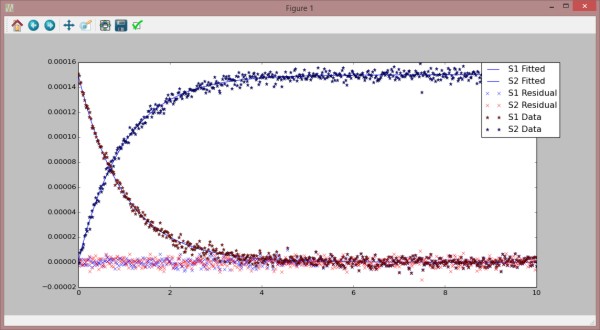
This example demonstrates parameter minimization, using the Levenberg-Marquardt algorithm. Output is shown in the image. To run the example, make sure you have some 'Experimental' data available.
2 import teplugins
as tel
5 chiPlugin = tel.Plugin(
"tel_chisquare")
6 lm = tel.Plugin(
"tel_levenberg_marquardt")
9 def pluginIsProgressing(lmP):
12 lmObject = ctypes.cast(lmP, ctypes.py_object).value
13 print 'Iterations = ' + `lmObject.getProperty(
"NrOfIter")` \
14 +
'\tNorm = ' + `lmObject.getProperty(
"Norm")`
17 progressEvent = tel.NotifyEventEx(pluginIsProgressing)
22 tel.assignOnProgressEvent(lm.plugin, progressEvent, theId)
26 test_model = tel.readAllText(
'two_parameters.xml')
30 experimentalData = tel.DataSeries.readDataSeries (
'ExperimentalData.dat')
31 lm.ExperimentalData = experimentalData
34 lm.setProperty(
"InputParameterList", [
"k1", 0.8])
35 lm.setProperty(
"InputParameterList", [
"k2", 2.3])
37 lm.setProperty(
"FittedDataSelectionList",
"[S1] [S2]")
38 lm.setProperty(
"ExperimentalDataSelectionList",
"[S1] [S2]")
43 hessian = lm.getProperty(
"Hessian")
44 print 'Hessian: \n' + `hessian`
46 cov = lm.getProperty(
"CovarianceMatrix")
47 print 'CovarianceMatrix: \n' + `cov`
49 print 'Minimization finished. \n==== Result ===='
50 print tel.getPluginResult(lm.plugin)
53 experimentalData = experimentalData.toNumpy
56 fittedData = lm.getProperty (
"FittedData").toNumpy
57 residuals = lm.getProperty (
"Residuals").toNumpy
59 tel.telplugins.plot(fittedData [:,[0,1]],
"blue",
"-",
"",
"S1 Fitted")
60 tel.telplugins.plot(fittedData [:,[0,2]],
"blue",
"-",
"",
"S2 Fitted")
61 tel.telplugins.plot(residuals [:,[0,1]],
"blue",
"None",
"x",
"S1 Residual")
62 tel.telplugins.plot(residuals [:,[0,2]],
"red",
"None",
"x",
"S2 Residual")
63 tel.telplugins.plot(experimentalData [:,[0,1]],
"red",
"",
"*",
"S1 Data")
64 tel.telplugins.plot(experimentalData [:,[0,2]],
"blue",
"",
"*",
"S2 Data")
65 tel.telplugins.plt.show()
67 except Exception
as e:
68 print 'Problem.. ' + `e`
 1.8.4
1.8.4

