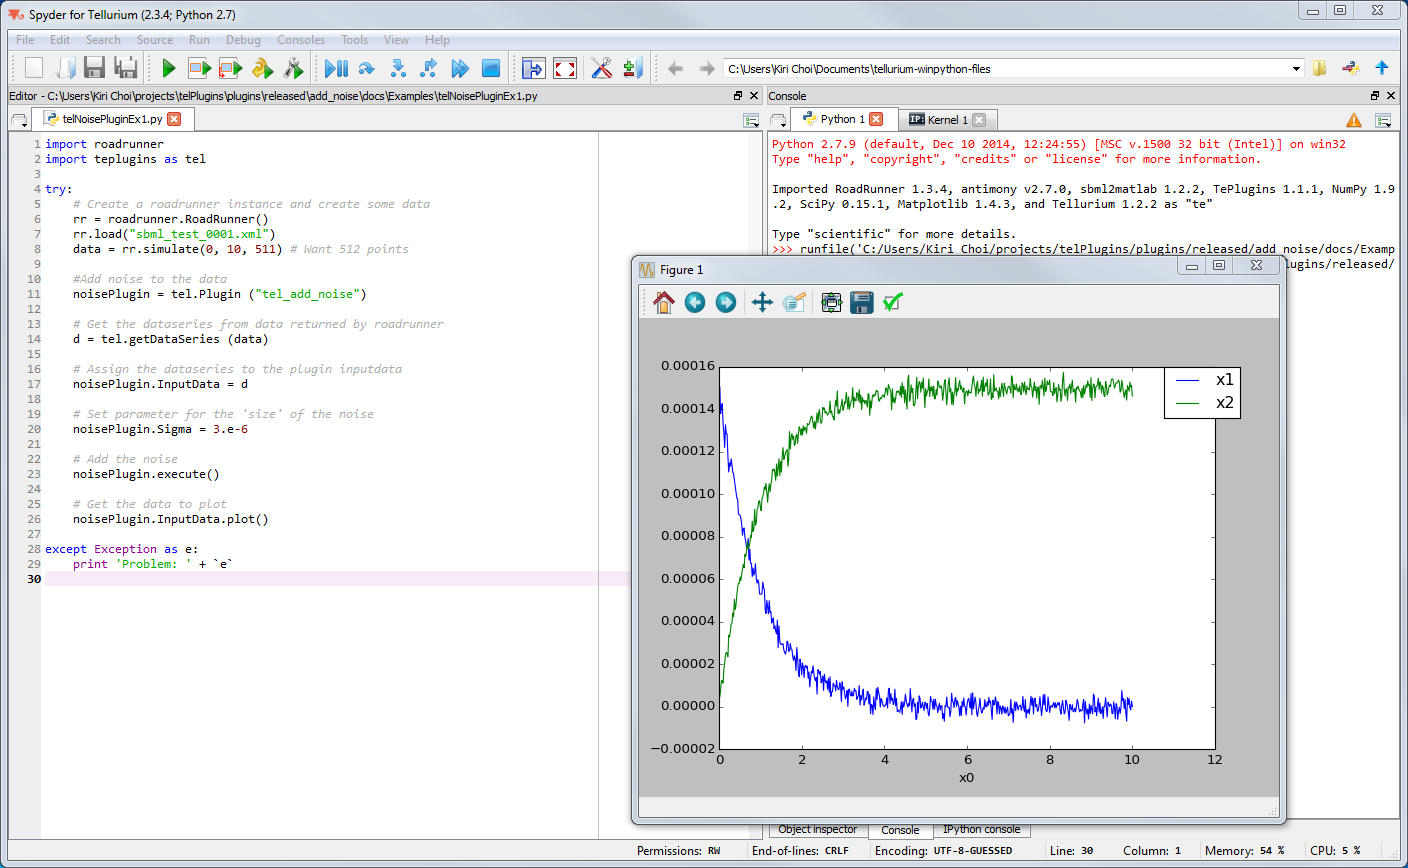
Figure 1.1: Output for the AddNoise python example script discussed above
The purpose of the AddNoise plugin is to introduce random noise to Tellurium data.
Noise generation uses the fact that a Rayleigh-distributed random variable R, with the probability distribution F(R) = 0 if R < 0 and F(R) = 1 - exp(-R2∕2 * σ2) if R >= 0, is related to a pair of Gaussian variables C and D through the transformation C = R * cos(θ) and D = R * sin(θ), where θ is a uniformly distributed variable in the interval (0, 2 * π()) 1
Currently only Gaussian noise is implemented.
Table 1.1 lists available plugin property names, along with their data type and purpose.
| Parameter Name | Data Type | Purpose |
| InputData | TelluriumData | Data on which noise will be applied to. |
| Sigma,(σ) | double | Size of applied noise. Noise is generated for each single data value, with a probability corresponding to a Gaussian distribution, centered around the value, and with a variance equal to σ2 . |
| NoiseType | int | Type of noise applied on data. Only Gaussian noise is currently supported. |
| Progress | double | The progress property communicates the progress (in percent) of Noise application. |
The AddNoiseplugin uses all of the available plugin events, i.e. the PluginStarted, PluginProgress and the PluginFinished events.
The available data variables for each event are internally treated as pass trough variables, so any data, for any of the events, assigned prior to the plugin’s execute function (in the assignOn() family of functions), can be retrieved unmodified in the corresponding event function.
| Event | Arguments | Purpose |
| PluginStarted | void*, void* | Signals to application that the plugin has started applying noise on data. Both parameters are pass through parameters and are unused internally by the plugin. |
| PluginProgress | void*, void* | Communicates progress of noise generation. Both parameters are pass through parameters and are unused internally by the plugin. |
| PluginFinished | void*, void* | Signals to application that execution of the plugin has finished. Both parameters are pass through parameters and are unused internally by the plugin. |
The execute() function will apply noise to all rows and columns of the assigned data, with one exception. Data not affected are data in the first column, and if, and only if, its column header equals ”time” (case insensitive).
The execute(bool inThread) method supports a boolean argument indicating if the execution of the plugin work will be done in a thread, or not. Threading is fully implemented in the AddNoise plugin.
The inThread argument defaults to false.
The python script below shows how to acquire simulation data from RoadRunner and pass it to the noise plugin. The format of this data, which is obtained from the simulate() function (line 8), is not directly compatible with the Noise plugin’s InputData property. This incompatibility is handled by an intermediate data structure in Python, called DataSeries (line 14).
The plugin’s properties, InputData and Sigma, are assigned on line 17 and 20 respectively.
Line 23 denotes the execution of the noise plugin, and after that has finished, data can be visualized by using the plot function (line 26). The output is shown below the script.
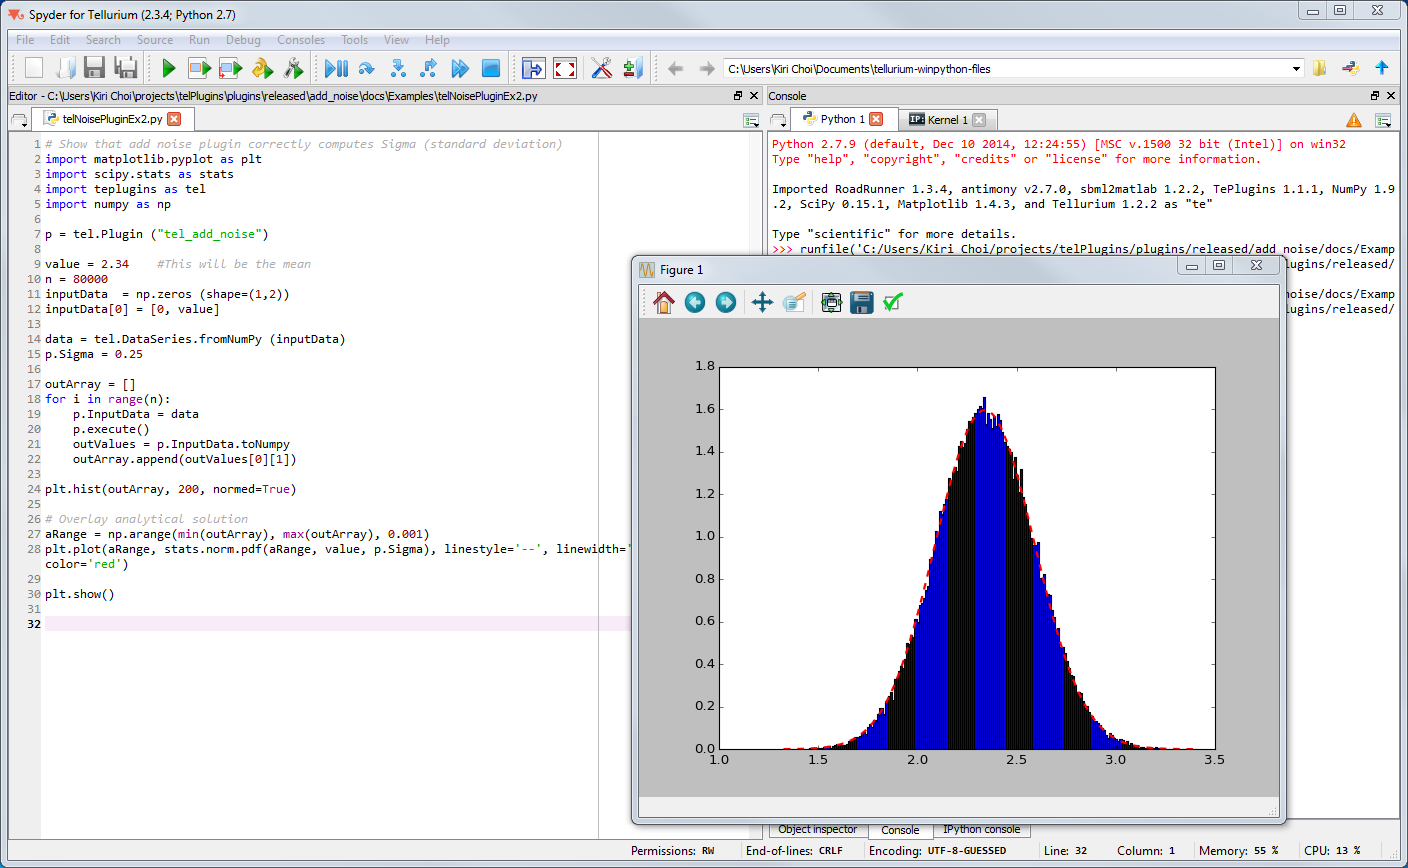
The Python script below demonstrates how to obtain and visualize the actual distribution (Gaussian) of noise that is applied on data.